Analytics & Profitability Reporting
Profit & Loss statements, inventory analytics, multi-channel reporting, and actionable dashboards — turn data into profit decisions.
From Raw Data to Strategic Clarity
We transform complex e-commerce data into clear, actionable reports that drive profitability.
Profit & Loss Reporting
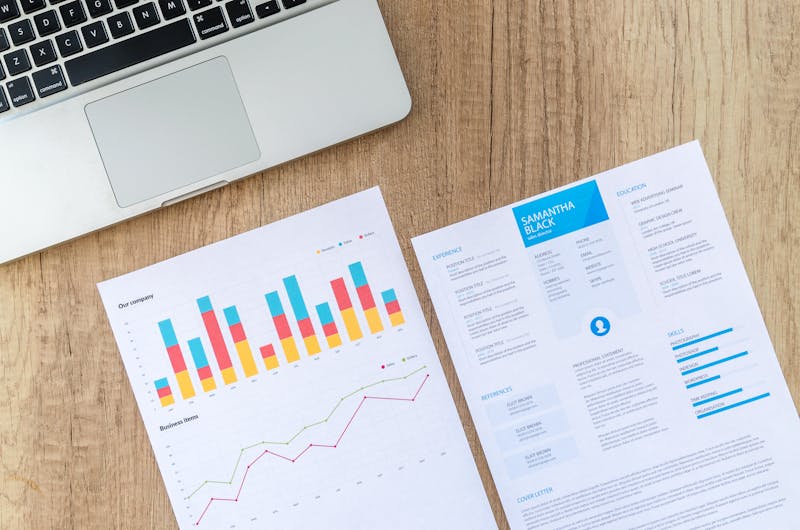
Comprehensive P&L statements across Amazon, Flipkart, Shopify, Meesho. Track revenue, COGS, shipping, ads spend, fees, and net profit — SKU-level clarity.
Learn more →
Sales & Revenue Analytics
Daily sales tracking, revenue trends, conversion funnels, and cohort analysis. Identify best-sellers, seasonality, and growth opportunities.
Explore →
Inventory & COGS Analytics
Inventory turnover, stock-out alerts, landed cost tracking, and margin analysis. Optimize cash flow and reduce holding costs.
See work →
Advertising ROI Reports
Amazon PPC, Google Ads, Meta spend analysis. ACOS, ROAS, CPC trends with actionable recommendations to maximize ad efficiency.
Learn more →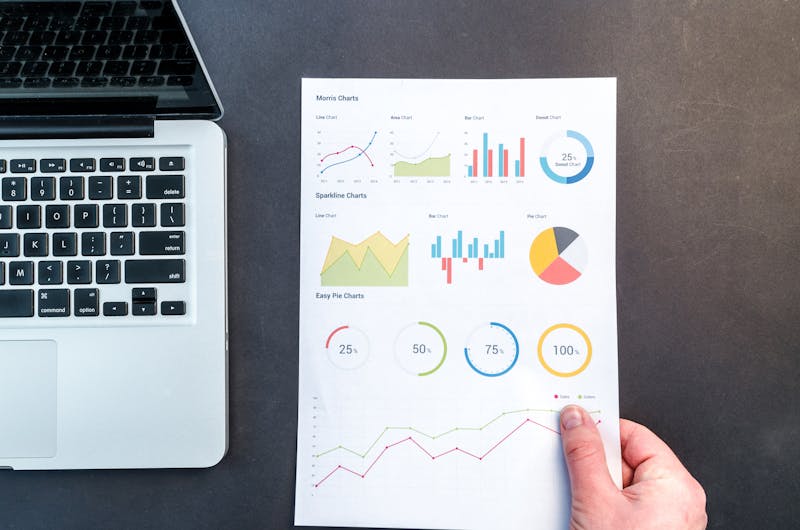
Custom BI Dashboards
Interactive dashboards (Looker, Tableau, Power BI) tailored to your KPIs. Real-time insights accessible anywhere.
Explore →
Forecasting & Planning
Sales forecasting, inventory demand planning, and profitability projections for data-backed business growth.
See samples →SKU-Level Profit & Loss Clarity
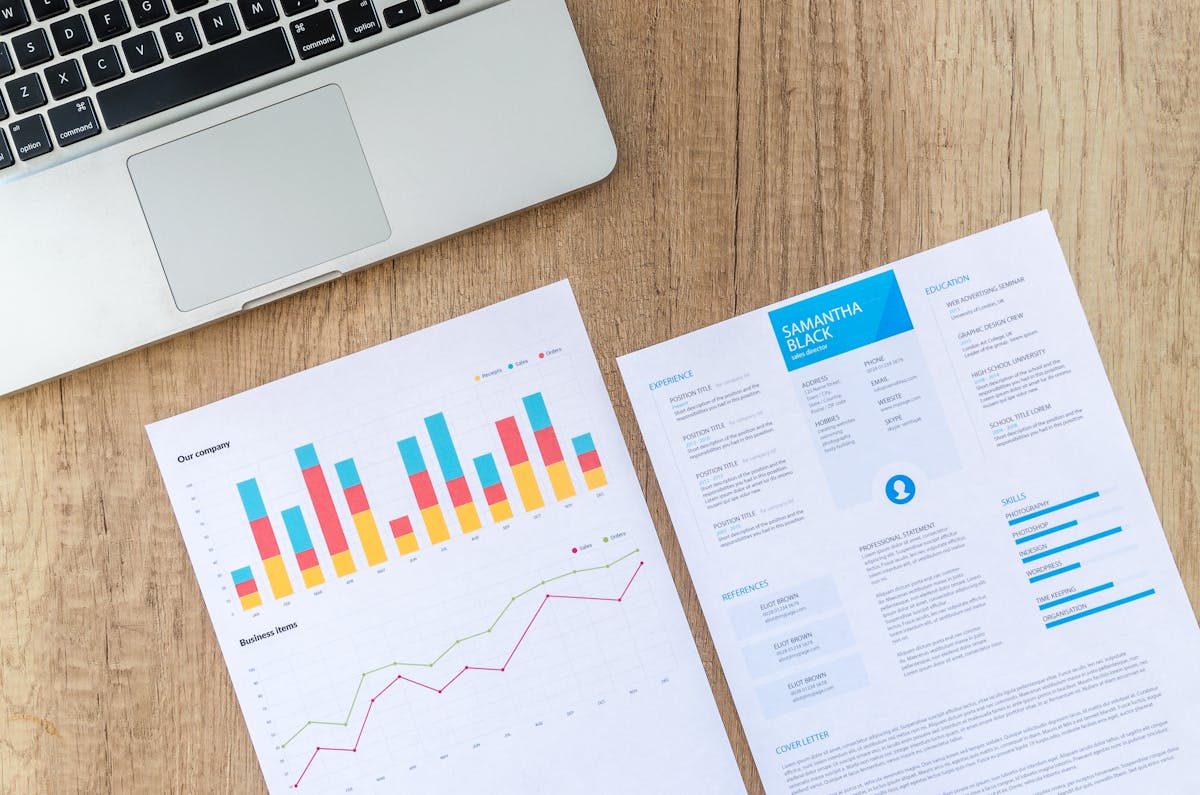
Stop guessing your real profitability. We break down every cost — marketplace fees, shipping, ads, returns, fulfillment — to show you exact net profit per product.
Reporting Services We Offer
Actionable intelligence for every stakeholder — from founders to finance teams.
Executive Dashboards
High-level KPIs, revenue trends, and profitability snapshots for leadership teams.
Detailed Operational Reports
Order-level, SKU-level, and channel-level deep dives with variance analysis.
Automated Scheduled Reports
Daily, weekly, monthly reports delivered automatically via email/Slack/Teams.
Advertising ROI Analysis
PPC performance, attribution modeling, and ad profitability per campaign.
Inventory Health Reports
Stock levels, velocity, aging inventory, and reorder recommendations.
Custom BI Integration
Connect your data sources (Amazon SP-API, Shopify, ERP) into unified dashboards.
30%
Avg. profit increase with our P&L insights
500+
Monthly reports generated
10+
Marketplaces integrated
99%
Data accuracy guarantee
Real Analytics Dashboards
See how we visualize profit, loss, and growth metrics



“EcomVistara's P&L reporting changed everything for us. For the first time, we could see exactly which products were profitable across channels. We increased net margin by 28% in 3 months!”
— Neha Gupta, COO of ArtisanHive
Turn Data Into
Higher Profits
Get a free analytics health check & sample P&L report. Our experts will help you uncover hidden profit leaks and growth opportunities.
Request Free Analytics Consultation
We'll send sample reports & proposal within 24 hours.